

You've launched a new healthcare service and want to A/B test your outreach strategy. But you immediately hit a wall: how do you measure success when you have no historical data? You're wondering, "How do we calculate expected LTV if it's a new service?" and you're frustrated by the lack of baseline conversion rates.
If this sounds familiar, you're not alone. Traditional metrics like Lifetime Value (LTV) are powerful for established services but fall critically short when testing new offerings. In healthcare contexts, where LTV may be defined as "impactable healthcare spend," the challenge is even more pronounced.
This article provides a practical framework for replacing LTV in early-stage A/B tests with leading indicators that deliver immediate, actionable insights. We'll explore KPIs that predict future value, segmentation strategies when flying blind, and specific applications for healthcare services and direct customer outreach.
Why Traditional LTV Fails in Early-Stage A/B Testing
Customer Lifetime Value (LTV) represents the total net profit a customer contributes throughout their entire relationship with your business. The classic predictive formula often looks something like:
LTV = Margin × (Retention Rate / (1 + Discount Rate - Retention Rate))
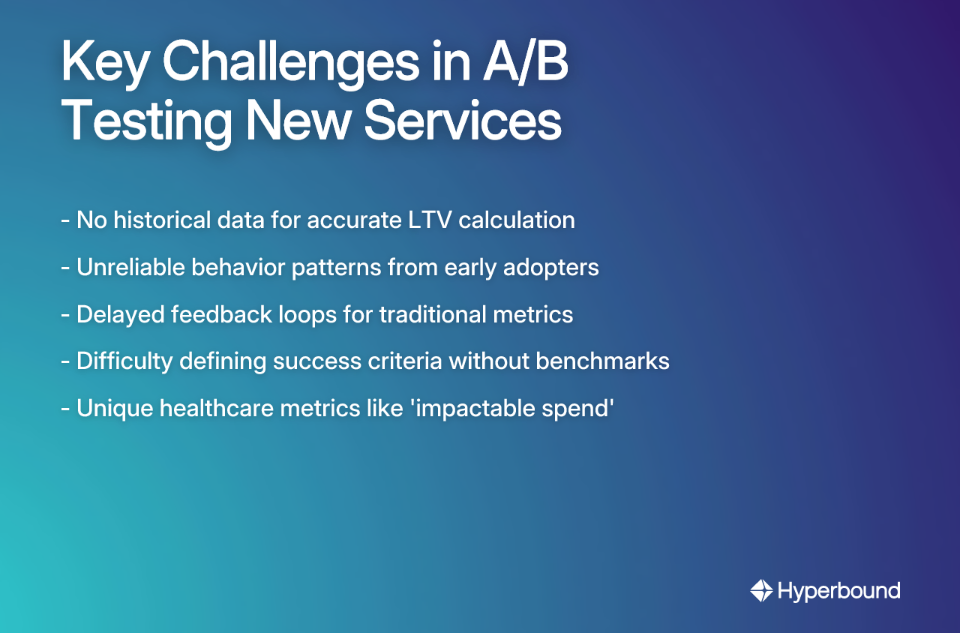
This calculation requires historical data to estimate key parameters accurately—data you simply don't have with a new service. Here's why relying on LTV for new service A/B testing creates more problems than it solves:
- No Historical Data: You cannot reliably estimate retention rates or average margins for customers you've just acquired. Any LTV calculation becomes pure speculation, not data-driven decision making.
- Unreliable Early Adopter Behavior: The first users of your service aren't representative of your broader market. Their behavior (high engagement, high tolerance for issues) can significantly skew LTV predictions.
- Delayed Feedback Loop: LTV is a lagging indicator that takes months or years to validate. In the critical early stages, you need metrics that provide immediate feedback to guide rapid iteration.
When running A/B tests for a new service, the primary goal isn't forecasting future revenue—it's learning what works and iterating quickly. This requires a shift from lagging indicators like LTV to leading indicators that serve as proxies for future value.
The Shift to Leading Indicators: Actionable Behavioral KPIs
Instead of predicting future value, measure current behaviors that strongly correlate with long-term success. These leading indicators tell you if you're on the right track without requiring years of historical data.
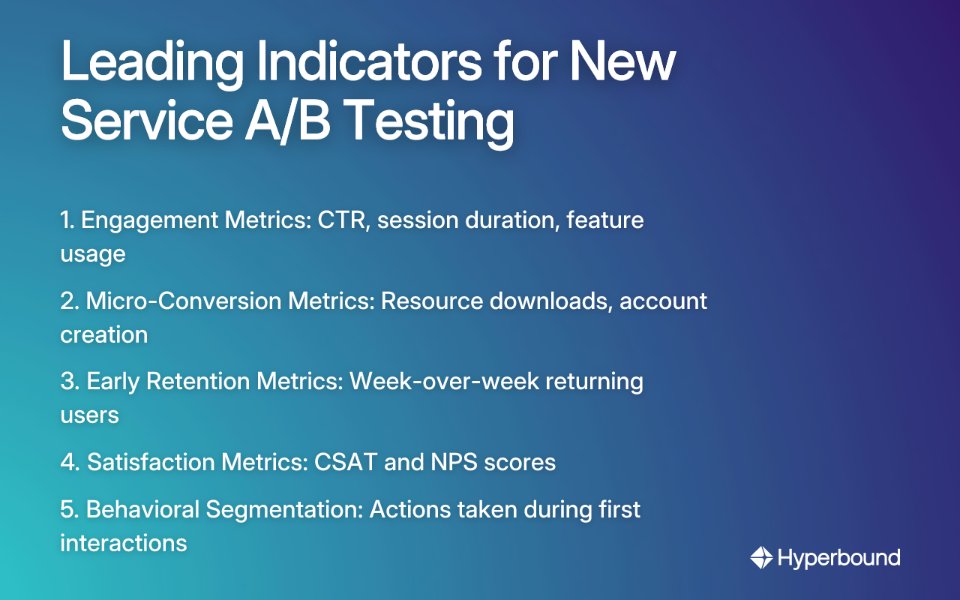
Engagement Metrics
These measure user interest and interaction—critical early signals of product-market fit.
- Click-Through Rate (CTR): Shows if your calls-to-action and messaging resonate with prospects.
- Calculation:
CTR = (Clicks / Impressions) × 100% - Example: If your healthcare newsletter has a 5% CTR versus the industry average of 2%, you're likely providing relevant content.
- Calculation:
- Average Session Duration: Longer sessions often indicate higher engagement and interest.
- For telehealth platforms, comparing session durations between different onboarding experiences can reveal which approach better engages users.
- Customer Journey Mapping: Track navigation paths to see which features users interact with most. High engagement with core features is a powerful positive signal that your service addresses real needs.
Micro-Conversion Metrics
Track smaller steps toward the final goal—these are your early warning system.
- Conversion Rate on Micro-Goals: Instead of focusing solely on final conversions, measure:
- Resource downloads (healthcare guides, wellness plans)
- Appointment scheduling attempts
- Account creation completion rates
- Free assessment or screening tool usage
- Abandonment Rate: Identify points of friction in your user funnels.
- Calculation:
Abandonment Rate = 100% - ((Tasks Completed / Tasks Initiated) × 100%) - High abandonment rates during registration or payment processes highlight areas for immediate improvement.
- Calculation:
Early Retention & Satisfaction Metrics
These provide a window into potential long-term value without requiring years of data.
- Retention Rate (Short-Term): Measure week-over-week or month-over-month returning users.
- Calculation:
Retention Rate = (Returning Users in Period / Total Users in Previous Period) × 100% - This is perhaps the most critical early indicator of product-market fit.
- Calculation:
- Customer Satisfaction Score (CSAT): Directly ask users how satisfied they are after key interactions.
- Calculation:
CSAT = (Positive Responses / Total Responses) × 100%
- Calculation:
- Net Promoter Score (NPS): Measures the likelihood of users recommending your service—a strong predictor of organic growth and long-term value.
How to Segment When You're Flying Blind
If you know nothing about prospective customers, you can at least test which sales strategy works better. The goal of early segmentation isn't perfect accuracy but discovering which groups respond best to your service.
Initial Segmentation Criteria
- Demographic: Basic factors like age, location, and profession provide a starting point. For healthcare services, this might include segmenting by insurance type or health conditions.
- Behavioral: Group users by their first key actions.
- Users who completed onboarding vs. those who didn't
- Users who engaged with Feature A vs. Feature B
- This helps understand what actions correlate with higher engagement and conversion.
- Acquisition Channel: Where did the user come from? (Organic Search, Paid Ad, Direct Outreach). Different channels often yield different quality prospects with varying conversion patterns.
A Methodology for Finding Meaningful Segments
- Formulate a Hypothesis: Start with a clear, testable assumption. "We believe prospective customers from the tech industry will have a 20% higher appointment booking rate than those from retail."
- A/B Test Your Hypothesis: Run targeted campaigns or product variations for these different segments using random assignment to ensure statistical validity.
- Analyze and Iterate: Use the behavioral KPIs discussed earlier to measure which segment performs better.

Putting It Into Practice: KPIs for Healthcare and Direct Outreach
Scenario 1: New Healthcare Service (Telehealth Platform)
Challenge: LTV is often defined as "impactable healthcare spend," which is difficult to measure and influence directly in the short term.
Alternative KPIs to Replace LTV:
- Primary Conversion: Appointment Booking Rate
- Engagement Proxies:
- Interaction with health resources (article views, video plays)
- Repeat logins within the first 30 days
- Satisfaction & Retention:
- Post-consultation CSAT score
- 30-day return rate for follow-up appointments
Sample A/B Test:
- Hypothesis: A more personalized onboarding experience will lead to higher first-time appointment booking rates.
- Control Group (A): Standard, quick sign-up form.
- Focal Group (B): Onboarding flow that asks users about their health goals to personalize the dashboard.
- KPIs to Measure: Onboarding completion rate, time-to-first-booking, and 7-day retention rate.
Scenario 2: Direct Customer Outreach (Outbound Calling Campaign)
Challenge: You want to test different strategies but are concerned about a lack of benchmarks and "over-testing."
Before launching a live A/B test with real prospects, you can refine your messaging and strategy in a simulated environment. Platforms like Hyperbound's AI Sales Roleplays allow your sales team to practice different call scripts and objection handling techniques against realistic AI buyer personas. This pre-testing phase helps identify the most promising approaches, ensuring your live test is more effective and less risky.
Alternative KPIs to Replace LTV:
- Contact Rate: Percentage of prospects the sales team successfully speaks to.
- Positive Response Rate: Percentage of contacted prospects who agree to a next step.
- Conversion Rate: Percentage of total prospects who become customers.
- Customer Acquisition Cost (CAC):
Total Campaign Cost / Number of New Customers.
Sample A/B Test:
- Hypothesis: Prioritizing follow-up calls will yield a higher conversion rate than maximizing first-time calls.
- Setup:
- Random Assignment: Take your list of prospective customers and randomly assign them to two groups for statistical validity.
- Control Group: Sales team's goal is to call as many new prospects as possible each day.
- Experiment Group: Sales team prioritizes follow-up calls with prospects who have shown interest, over making new first-time calls.
- KPIs to Measure: After two weeks, compare groups on Positive Response Rate, Conversion Rate, and CAC.
Conclusion: Measure What Matters Now
When launching a new service, traditional LTV can be a distraction. A/B testing should focus on learning and validation, not long-term forecasting. The key is to shift your focus to leading indicators that measure real-time user behavior:
- Track engagement metrics that show immediate interest
- Monitor micro-conversions that predict full conversions
- Measure short-term retention as an early proxy for LTV
- Segment methodically, even with limited data
- Use random assignment to ensure significance testing validity
- Focus on data quality over quantity in your early tests
Start with a clear hypothesis, randomly assign users to control and experiment groups, and measure the behavioral KPIs that matter for your service right now. This structured approach provides the clarity needed to build a successful service, one validated step at a time—no LTV required.
Frequently Asked Questions
What is a good substitute for LTV when A/B testing a new service?
The best substitutes for LTV are leading indicators—metrics that measure current user behavior and correlate with future success. This includes engagement metrics (like CTR and session duration), micro-conversions (like account sign-ups or resource downloads), and early retention rates (like week-over-week returning users). These provide immediate, actionable feedback to guide iteration.
Why is using traditional LTV not recommended for new product A/B tests?
Traditional LTV is not recommended for new products because it relies heavily on historical data for accurate calculations of retention rates and customer margins, which a new service lacks. Any LTV calculation would be speculative. Furthermore, early adopters' behavior is often not representative of the broader market, and LTV is a lagging indicator, meaning the feedback loop is too slow for the rapid iteration needed in early stages.
How do you choose the right leading indicators for your A/B test?
Choose leading indicators that align directly with the user actions that signal value and product-market fit for your specific service. For a telehealth platform, this could be the appointment booking rate or interaction with health resources. For a content-based service, it might be newsletter sign-ups or guide downloads. The goal is to measure behaviors that are logical stepping stones toward long-term customer retention and value.
How can you segment users for A/B testing when you have no existing customer data?
You can segment users based on observable criteria like acquisition channel, basic demographics, or their initial in-product behaviors. For example, you can group users by whether they came from a paid ad or organic search, or by the first feature they interact with. The goal isn't to create perfect segments but to form a hypothesis (e.g., "Users from paid ads will engage more") and test it to discover which groups respond best to your offering.
What is the difference between a leading and a lagging indicator?
A leading indicator is a predictive metric that signals future events, while a lagging indicator measures past performance. For example, the number of free trial sign-ups (a leading indicator) can help predict future paid subscriptions. In contrast, Lifetime Value (LTV) is a lagging indicator because it measures the total value a customer has already brought to the business over time. For new services, leading indicators are crucial for making fast decisions.
When is it appropriate to switch from leading indicators back to LTV?
It is appropriate to switch back to LTV once your service has matured enough to collect sufficient historical data, typically after several months to a year. When you have stable data on customer retention rates, purchasing habits, and margins, you can build a reliable LTV model. At this stage, LTV becomes a powerful tool for optimizing marketing spend and long-term strategy, while leading indicators remain useful for day-to-day product and feature testing.

Book a demo with Hyperbound


