.png)

.png)
You've been tasked with setting up A/B tests for your company's outbound sales campaigns. The sales team is eager to try multiple strategies simultaneously, your leadership wants concrete results yesterday, and you're staring at a massive prospect list with no historical conversion data. Sound familiar?
As a data scientist supporting sales teams, you're caught in a familiar dilemma: bringing statistical rigor to a domain traditionally driven by intuition and experience. The absence of baseline conversion rates for new services, uncontrollable variables like staff capacity, and concerns about drawing incorrect conclusions across multiple segments can make this challenge feel insurmountable.
But it doesn't have to be. This article presents a comprehensive framework that transforms your outbound sales testing from chaotic to methodical, ensuring you can provide data-driven guidance that sales teams can trust and implement.
The Foundations of Effective Sales A/B Testing
Why A/B Testing is Non-Negotiable in Outbound Sales
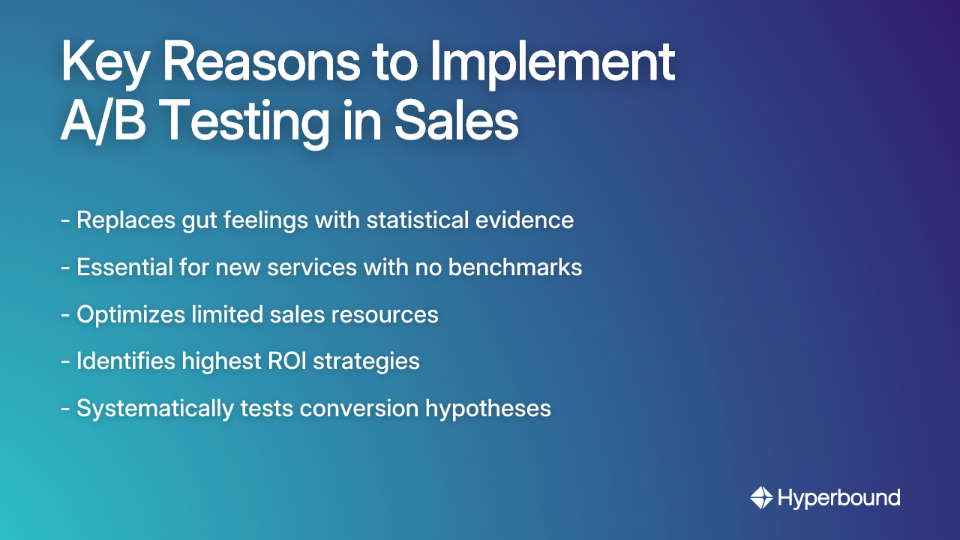
In outbound sales, where teams proactively reach out to generate new business through cold calling and emailing, A/B testing shifts decision-making from gut feelings to statistical evidence. This is particularly crucial when:
- You're launching a new service with no established conversion rate benchmark
- Sales resources are limited and need optimal allocation
- Your organization needs to identify which outreach strategies generate the highest ROI
A/B testing provides the framework to systematically test hypotheses about what drives prospective customers to convert, allowing you to optimize your outbound calling campaigns with confidence.
Step 1: Define Your Goal and Primary Metric
Before designing any experiment, you must define a clear, specific goal with a corresponding KPI. For outbound sales, the most common primary metric is conversion rate, calculated as:
Conversion Rate = (Number of sales ÷ Number of leads) × 100
For example, if your sales team contacts 100 prospects and 15 become customers, your conversion rate is 15%.
While LTV (Lifetime Value) is important for long-term strategy, it's often challenging to calculate for brand new services. Instead, focus on more immediate and measurable KPIs for your initial testing, such as:
- First-call-to-meeting conversion rate
- Call-to-opportunity conversion rate
- Meeting-to-proposal conversion rate
These proximate metrics provide faster feedback while you collect data to build more sophisticated LTV models that account for factors like impactable healthcare spend or other industry-specific value drivers.
Step 2: Formulate a Clear, Testable Hypothesis
A strong hypothesis is specific, measurable, and rooted in a reasonable assumption about prospect behavior. Structure your hypothesis as:
"If we change [Independent Variable], then [Dependent Variable] will [Expected Outcome] because [Rationale]."
For example:
Hypothesis A: "If we prioritize follow-up calls over new first-time calls (strategy), then our conversion rate will increase by at least 20% because repeated contact builds trust and demonstrates persistence."
Hypothesis B: "If we personalize the first 30 seconds of our call script with company-specific research, then our meeting booking rate will increase because prospects will perceive greater value and relevance."
Before deploying a new script in a live A/B test, it's crucial to ensure your sales team can deliver it consistently. Platforms like Hyperbound allow reps to practice new messaging in realistic AI roleplays, helping to isolate the script itself as the primary variable by reducing performance variability.
The Core Methodology: Structuring Your Experiment
Random Assignment: The Foundation of Valid Testing
Random assignment is the cornerstone of any credible A/B test. It ensures that each prospect has an equal chance of being placed in either your control or focal group, minimizing selection bias and strengthening internal validity.
When properly executed, random assignment helps distribute all known and unknown variables (like prospect industry, size, or potential LTV) evenly between groups, allowing you to attribute any difference in outcomes to your tested strategy rather than pre-existing differences.
Step-by-Step Implementation for Sales Prospect Lists
- Prepare Your Prospect Data
- Consolidate your entire prospect list into a single dataset
- Ensure each prospect has a unique identifier
- Clean the data to remove duplicates and incomplete entries
- Code Your Random AssignmentHere's a simple Python implementation using pandas:
import pandas as pd
import numpy as np

# Load your prospect list
prospects = pd.read_csv('prospect_list.csv')

# Add a random number column
prospects['random_number'] = np.random.random(len(prospects))

# Assign to groups based on random number
prospects['test_group'] = np.where(prospects['random_number'] < 0.5, 'Control', 'Focal')

# Save the assignments
control_group = prospects[prospects['test_group'] == 'Control']
focal_group = prospects[prospects['test_group'] == 'Focal']- Verify Balance Between GroupsBefore proceeding, verify that key characteristics (industry, company size, etc.) are distributed similarly between groups. This additional check safeguards against random chance creating imbalanced groups.
Creating Focal and Control Groups for High-LTV Prospects
When dealing with high-value prospects, you may want to ensure balanced representation in both test groups. This is particularly important when your sales team has identified segments with significantly different LTV potential.
For these scenarios, use stratified random sampling:
- Segment Your Prospects first by important characteristics (e.g., high-LTV vs. standard-LTV)
- Randomly Assign Within Each Segment to ensure proportional representation in both control and focal groups
# Assuming 'ltv_segment' column exists with values 'High' and 'Standard'
high_ltv = prospects[prospects['ltv_segment'] == 'High']
standard_ltv = prospects[prospects['ltv_segment'] == 'Standard']

# Random assignment within each segment
high_ltv['test_group'] = np.where(np.random.random(len(high_ltv)) < 0.5, 'Control', 'Focal')
standard_ltv['test_group'] = np.where(np.random.random(len(standard_ltv)) < 0.5, 'Control', 'Focal')

# Recombine
prospects = pd.concat([high_ltv, standard_ltv])
This approach ensures that both your control and focal groups contain similar proportions of high-value prospects.
Execution and Analysis
Determining Sample Size and Test Duration
Before launching your test, calculate the required sample size to achieve statistical significance. This step is non-negotiable - without an adequate sample, your results will be inconclusive regardless of observed differences.
The required sample size depends on:
- Your baseline conversion rate (or best estimate)
- The minimum effect size you want to detect
- Your desired confidence level (typically 95%)
- The statistical power (typically 80%)
For outbound sales tests, where conversion rates are often in the single digits, you'll typically need hundreds or even thousands of prospects per group to detect meaningful differences.
Use a sample size calculator to determine your specific requirements.
Important: Run both versions (control and focal) simultaneously to avoid time-based confounding factors like seasonal variations or market events.
Measuring Results and Statistical Significance
After collecting sufficient data, calculate the conversion rate for both groups using the formula mentioned earlier. The key question becomes: is the observed difference statistically significant?
For a simple approach, use a chi-square test or two-proportion z-test to determine if the difference between conversion rates is statistically significant. Most statistical software packages and even Excel can perform these calculations.
from scipy import stats

# Example data
control_conversions = 45
control_total = 500
focal_conversions = 60
focal_total = 500

# Calculate conversion rates
control_rate = control_conversions / control_total
focal_rate = focal_conversions / focal_total

# Perform statistical test
z_stat, p_value = stats.proportions_ztest(
    [focal_conversions, control_conversions],
    [focal_total, control_total]
)

print(f"Control conversion rate: {control_rate:.2%}")
print(f"Focal conversion rate: {focal_rate:.2%}")
print(f"p-value: {p_value:.4f}")
print(f"Statistically significant: {p_value < 0.05}")
Common Pitfalls and Best Practices
Mistakes to Avoid
- Testing Multiple Variables SimultaneouslyWhen testing "prioritizing follow-up calls" and "using a new call script" at the same time, you won't know which change caused any observed effect. Keep it simple: one variable per test.
- Peeking at Results Too EarlyChecking results before reaching your predetermined sample size can lead to false positives. Commit to your test duration upfront.
- Ignoring External FactorsData quality issues, sales staff capacity fluctuations, and market events can all impact results. Document these factors during your test period.
Best Practices for Data Scientists

- Start With High-Volume SegmentsWhen dealing with high-volume prospect lists, begin testing with your largest segments to reach statistical significance faster.
- Document EverythingMaintain a testing log with hypotheses, variables, sample sizes, duration, and results to build institutional knowledge.
- Communicate Clearly With StakeholdersTranslate statistical findings into business language. Don't just report p-values; explain what the results mean for sales strategy and expected impact on KPIs.
- Iterate Based on ResultsUse insights from each test to inform subsequent hypotheses, creating a continuous improvement cycle.
Conclusion: From Data to Decisions
Implementing a rigorous A/B testing framework transforms outbound sales from an intuition-driven practice to a data-optimized operation. By following this methodology, you'll provide clear guidance on which strategies genuinely drive higher conversion rates and maximize the return on your sales team's efforts.
Start with a single, well-designed test to demonstrate the value of this approach. As you build confidence in the process, you can expand to more sophisticated testing schemes while maintaining statistical validity.
Remember that even with perfect methodology, the ultimate goal is actionable insights that sales teams can implement. A statistically significant finding that's too complex to execute provides little value. Keep your tests practical, your metrics clear, and your recommendations actionable.

By bridging the gap between statistical rigor and sales practicality, you'll become an invaluable partner in driving your organization's outbound sales success.
Frequently Asked Questions
What is A/B testing in outbound sales?
A/B testing in outbound sales is a methodical approach to compare two versions of a single variable, such as a call script or an email subject line, to determine which one performs better at achieving a specific goal. This process replaces guesswork with statistical evidence, allowing sales teams to systematically test hypotheses and identify the most effective strategies for converting prospects.
Why is random assignment crucial for sales experiments?
Random assignment is crucial because it ensures that any observed difference in performance between your two test groups is due to the change you made, not pre-existing differences in the prospects themselves. By giving every prospect an equal chance of being in the control or focal group, you minimize selection bias and distribute all other variables (like company size, industry, or need) evenly, leading to valid and trustworthy results.
How do I choose the right metric for my sales A/B test?
Choose a primary metric that is directly tied to the specific goal of your test and can be measured relatively quickly. The most common metric is conversion rate, but for faster feedback, you might focus on more immediate KPIs like the first-call-to-meeting conversion rate or the call-to-opportunity rate. These provide actionable insights while you gather data for longer-term metrics like Lifetime Value (LTV).
How many prospects do I need for a reliable A/B test?
The number of prospects you need depends on your baseline conversion rate, the expected improvement (minimum effect size), and your desired statistical confidence. For outbound sales, where conversion rates are often low, you will typically need hundreds or even thousands of prospects in each group (control and focal) to achieve statistically significant results. Always use a sample size calculator before starting your test to determine the specific number required.
What is the most common mistake in sales A/B testing?
The most common mistake is testing multiple variables at the same time. For example, changing both the call script and the time of day you call simultaneously. When you do this, you cannot be certain which change caused the outcome, making the results unusable. To get clear, actionable insights, you must isolate a single variable for each test.
How do I test different strategies for high-value prospects without risk?
To test strategies on high-value prospects, use a technique called stratified random sampling. This involves first segmenting your prospect list into "high-value" and "standard" groups, and then performing random assignment within each segment. This method ensures that high-value prospects are evenly distributed between your control and focal groups, allowing you to test new approaches while maintaining a balanced comparison.
Book a demo with Hyperbound


